


|
||

|

|
|

|
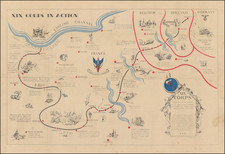
Fascinating data visualization mapping of the economic situation in the so called Bizonal Area.
The term "Bizonal" or "Bizone" in this context refers to Bizonia, a critical part of Germany's history in the immediate aftermath of World War II. The victorious Allies divided Germany into four zones of occupation. Bizonia was the result of a merger between the American and British zones on January 1, 1947. This move was a strategic one, aimed at rebuilding and stabilizing the war-torn nation.
The present map provides a snapshot of the economic status of the Bizonia at a pivotal moment in history.
The map, covered in a network of symbols, lays out the rich economic landscape of the combined American and British zones in the late 1940s. Through a detailed legend or "ZEICHEN-ERKLÄRUNG," each type of economic activity within the Bizonia is assigned a distinct symbol.
"OLFELDER" or oil fields are marked by dark, teardrop-shaped icons spread across the Bizonal Area, indicating an abundance of oil reserves. "EISEN-U. STAHLWERK" or iron and steel plants are depicted as geometric symbols clustered in certain areas, showcasing the region's strong industrial core.
Areas marked as "EINSCHLAGGEBIETE FÜR NUTZHOLZ" or timber-producing regions are adorned with lush, green, tree-shaped symbols, indicating the importance of the timber industry. "KOHLEN-FORDERGEBIETE" or coal fields, essential for heavy industry, are represented by solid, black square icons, mainly found in the northern parts of the Bizonal Area.
Round symbols scattered across the map represent "CHEMISCHE INDUSTRIE" or chemical plants, highlighting the significance of the chemical industry in transforming raw materials into various essential products. The "ZWEIZONEN-GRENZE" or bizonal boundary, depicted as a dashed line, distinctly marks the territories of the two original zones, while the "LÄNDER-GRENZE" or land boundary is a firm line delineating the geographical extent of each region within the Bizonal Area.
the primary map is surrounded by graphs illustrating the growth in production of a number of commodities from January 1946 to October 1848, including:
- Coal Production
- Steel Production
- Electricity
- Gas Production
- Petroleum, Oil and Lubricant Production
- Rail Freight
- Import & Export
- Industrial Production and Employment
- Textile and Shoe Production
- Motor Vehicle Production
- Paper & Pulp Production
- Chemcial Fertilizer Production
- Sawn Timber Production
Collectively, the map of the Bizonal Area weaves a rich tapestry of diverse economic activities at a time of critical recovery and transformation. The resilience of this region, amid significant historical challenges, is echoed in the diversity and density of economic symbols spread across the map.
![[ Holy Roman Empire ] A New Map of the German Empire, and the Neighbouring States with their Principal Post Roads, Originally Published by the Royal Academy of Berlin . . . 1788](https://storage.googleapis.com/raremaps/img/small/102913.jpg)
![[First Postwar Elections in Germany] Elections au Bundestag 14 Aout 1949 Zone Francaise](https://storage.googleapis.com/raremaps/img/small/78830.jpg)
![[ Holy Roman Empire ] Germania, Non ea tantum quae Rheno, Vistula, Danubio, mariqz Germanico Veteribus claudebatur; Sed tota illa continens quae hodie communiter Germanica lingua utitur . . .](https://storage.googleapis.com/raremaps/img/small/99236.jpg)
![[ Holy Roman Empire ] A Newe Mape of Germany Newly Augmented by Iohn Speed Ano Dom: 1626](https://storage.googleapis.com/raremaps/img/small/68482.jpg)