


|
||

|

|
|

|
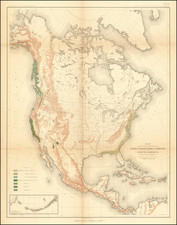
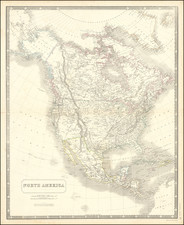
Isothermal Map of North America
Large map of North America, offering a detailed cartographic representation of the varying temperatures of North America.
This isothermal map of North America illustrates the distribution of temperature across the continent. The map uses color coding and contour lines to depict both the temperature variations and the topographical features of the region. It features isothermal lines, which are contour lines that connect points of equal temperature. These lines are marked with specific temperature values in degrees Fahrenheit. The red lines indicate the average temperatures for July, while the blue lines represent the average temperatures for January. The temperatures range from as low as -40°F in the northernmost parts of Canada and Greenland to 80°F in the southern regions of the United States, Mexico, and the Caribbean.
The map also includes a reference for the height of the land, using a color gradient to show different elevations: dark brown indicates elevations over 8000 feet; brown represents elevations between 4500-6000 feet; light brown shows elevations from 3000-4500 feet; tan indicates elevations from 1000-3000 feet; light green shows areas from 0-1000 feet above sea level; and dark green indicates regions below sea level.
In the lower left corner, there are smaller inset maps providing more detailed views of specific regions. A smaller map shows the isothermal lines for July and January in Europe and the Middle East, providing a comparison to North American temperatures. Another inset shows the depth of the sea around the continent, with blue gradients indicating different depths: light blue represents depths from 0-100 fathoms; medium blue shows depths from 100-1000 fathoms; dark blue indicates depths from 1000-2000 fathoms; and very dark blue represents depths below 2000 fathoms.
The map is scaled at 1:9,000,000, approximately 150 miles to an inch, offering a broad yet detailed view of the continent's climatic patterns. The meticulous detailing of temperature variations and topographical features provides valuable insights into the climatic conditions and geographical diversity of North America during the mid-20th century.
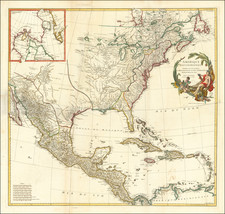
![[ Sea of the West ] L'Amerique Septentrionale divisee en ses principaux Etats . . . 1782](https://storage.googleapis.com/raremaps/img/small/80228.jpg)