


|
||

|

|
|

|
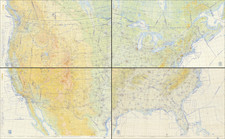
Fine large map published by the American Forestry and Paper lobby, showing a comprehensive overview of the forests and trees across the United States, detailing the expansive and varied arboreal landscape of the nation.
The map serves as both a geographical representation of forests and a botanical tapestry, illuminating the diversity of tree species and forest types that compose the American ecological fabric, with illustrations of many species.
At the heart of this map lies the fundamental division of forest lands into two categories: commercial and non-commercial forests. About 60% of the forest land, as the map illustrates, is designated as commercial, where timber is actively harvested for economic purposes. The remaining 40% is categorized as non-commercial, consisting of less accessible tracts that serve crucial ecological roles, such as preserving biodiversity and safeguarding watersheds.
The map delineates several significant forest regions within the United States, each characterized by distinctive tree species adapted to the specific climates and soils of their environments. For instance, the West Coast forests, recognized for their coniferous giants, are dominated by species such as the Douglas fir, redwood, western hemlock, and sitka spruce. These regions are depicted in dark green, indicating their commercial value, particularly in timber and paper production industries.
Moving inland, the Rocky Mountain forests are represented, hosting species like the ponderosa pine, lodgepole pine, and blue spruce. In the central hardwood forests, a wide array of species including white oak, sugar maple, and American beech are prevalent, marking the transition from the conifer-dominant West to the broad-leaved East.
The southern forests feature a blend of both hardwoods and softwoods, with loblolly pine, shortleaf pine, and sweetgum being prominent. These regions are strategically important for the wood-using industries, contributing significantly to the nation's economy through the production of lumber, paper, and other wood products.
The map's periphery is adorned with illustrations of various tree species, which are not just artistic embellishments but also serve an educational purpose. Each depicted species is numbered, corresponding to a key that indicates the species' prevalence in specific regions of the United States.
Furthermore, the map provides statistical insights into the wood-using industry's scale, mentioning an annual payroll of 7 billion dollars and its ranking as the nation's fourth-largest manufacturing employer. It emphasizes the sector's contribution to the country’s economic strength and the commercial forests' role in sustaining the industry.
In summary, this map of the United States’ forests and trees is an informative document that does more than depict the geography of woodlands; it portrays the intricate relationship between the nation's forests and its economic vitality. It stands as a testament to the significance of forests in the environmental and economic realms, highlighting the vastness and variety of the country's arboreal resources.
Dating The Map
The map was offered as an educational tool over a number of years. We note an reference to the publication of the map in American Congress on Surveying and Mapping Quartly Journal, for March 1962 (page 113). We note its inclusion in the National Education Assocation's Learning from Pictures Publication, in 1968. The American Philosophical Society notes that they received a presentation copy from the author in August 1962.
![[ Atlas of The United States ] Karte von Amerika](https://storage.googleapis.com/raremaps/img/small/84353mp2.jpg)